7 min read · September 16, 2026
How a US Coast Survey chart was actually made
Every sounding on a nineteenth-century chart is one man, one lead weight, one rope, and one moment. Here is the chain of work behind a sheet that took a decade and cost more than the ships.
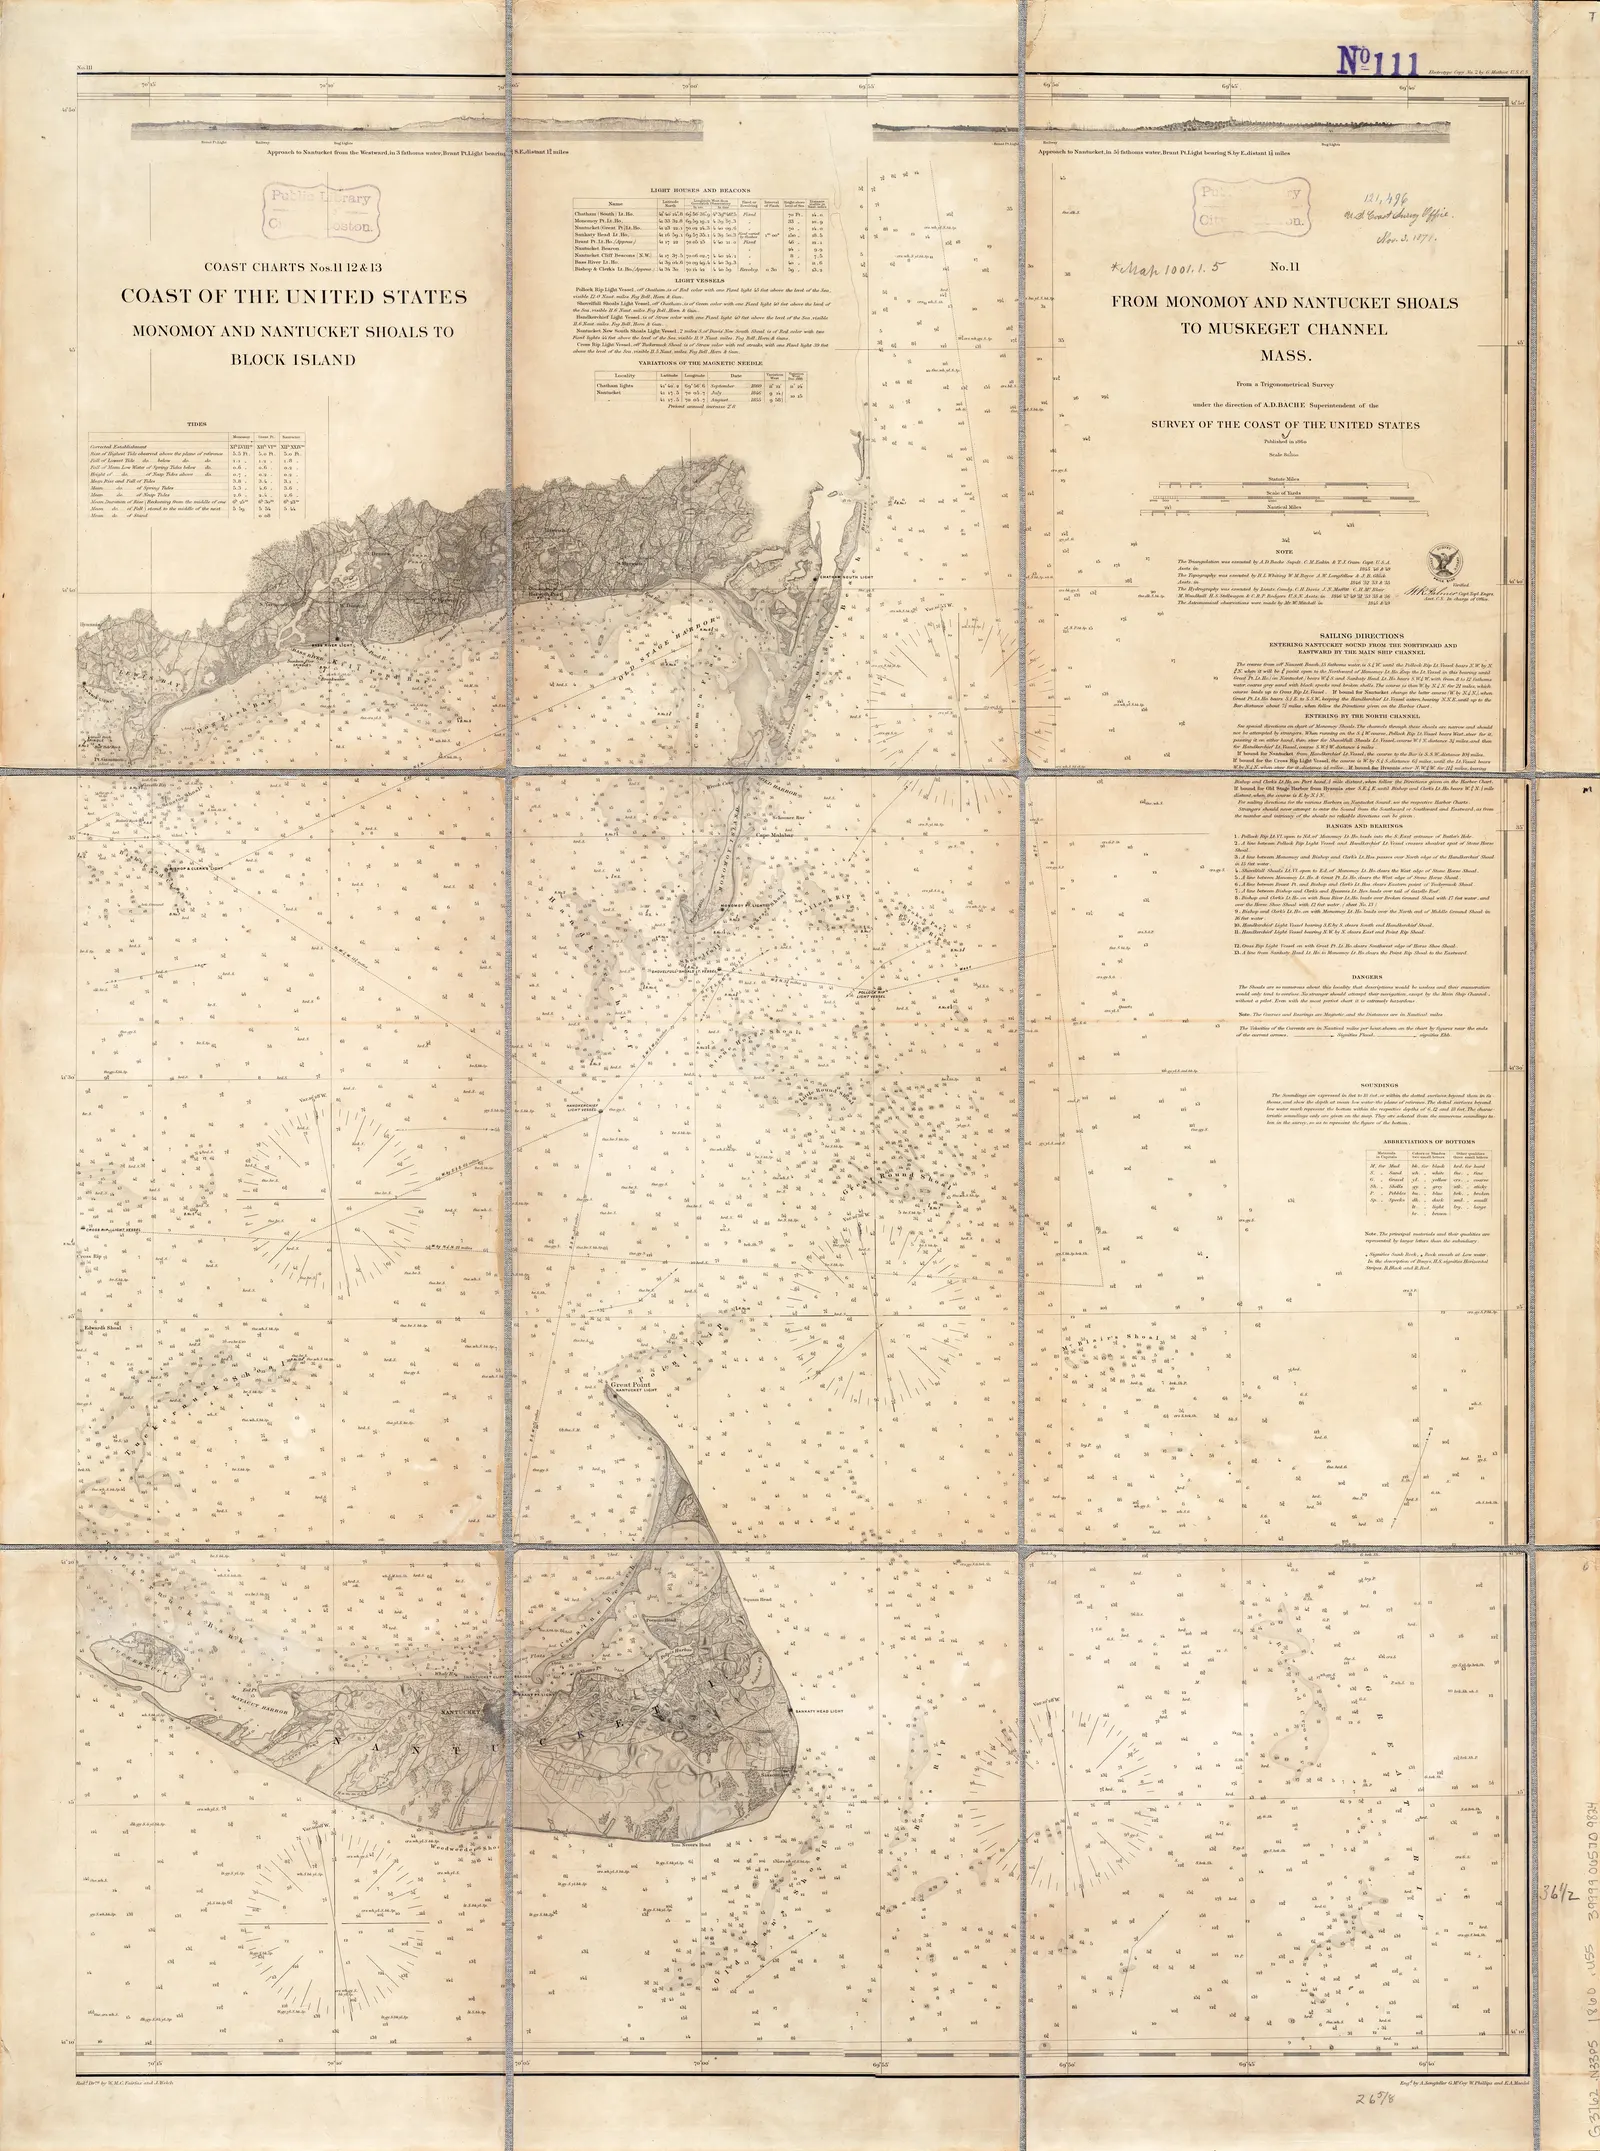
Look at a nineteenth-century harbour chart and you will see hundreds of small numbers scattered across the water. Each one is a depth in fathoms or feet. Each one is also a record of a specific afternoon in which a man in a small boat dropped a weighted rope over the side, felt it touch bottom, read the mark, and shouted a number at someone with a notebook.
There is no other way it was done. There were no echo sounders until the 1920s. A chart of a large bay represents tens of thousands of those moments, corrected for the tide, fixed in position by angle, and inked by hand.
The chain of work
Triangulation first. Before anything could be measured, the coast had to be given a skeleton. A baseline was measured on land with extreme care — sometimes over weeks, with compensating bars to allow for temperature. From its two ends, angles were taken to a distant third point, and trigonometry gave its position without anyone walking there. That triangle became the base of the next, and the next, until a mesh of precisely known points covered the coast. Everything else hangs off it.
Topography and shoreline. Plane-table surveyors walked the shore and drew it in the field, tying every feature back to the triangulation stations.
Hydrography. Then the boats. Sounding lines were run in systematic patterns while two observers on shore, or a sextant operator in the boat, fixed its position by simultaneous angles to known points. Every depth was reduced to a common datum — usually mean low water — which meant the tide had to be recorded continuously at a nearby gauge for the whole survey.
Engraving. The compiled sheet was cut in reverse into a copper plate by hand, by a specialist who would spend months on one chart. Different engravers cut lettering, shoreline and hachures; you can often see the different hands on one sheet.
The US Coast Survey was established in 1807 under Thomas Jefferson and remains one of the oldest scientific agencies in the country, now part of NOAA. Under Alexander Dallas Bache — Benjamin Franklin’s great-grandson — it became the best-funded scientific organisation in the United States. Surveys of a single major bay routinely took a decade.
What the marks mean
A chart is dense because it is instructions, not decoration.
- Soundings — the scattered numbers. Fathoms (six feet) in deeper water, often feet in shoal water, with the unit stated in the title block.
- Fathom curves — the fine lines linking equal depths. These are what make the underwater shape legible; follow the 3-fathom curve and you are looking at the edge of safe water for most vessels of the period.
- Bottom notation — tiny abbreviations beside soundings. S sand, M mud, G gravel, Rky rocky, hrd hard, sft soft. Not trivia: it tells you whether your anchor will hold.
- Light characteristics — F fixed, Fl flashing, Rev revolving, with the period in seconds and the height above high water. A mariner identified a light at night by its rhythm alone.
- Compass roses — usually two, one true and one magnetic, with the magnetic variation and the year it was measured. Variation drifts, so the date is essential.
- Sailing directions and views — many sheets carry a strip of coastal profiles along the top: what the land looks like from seaward at a stated bearing and distance.
Why they work on a wall, and why generic coastal art does not
A chart was drawn to be read at arm’s length by someone who needed the information. That gives it a density no decorative print has, and it is why people stand in front of one instead of glancing at it.
It is also about a place. Not “the ocean” — Nantucket Shoals, the Golden Gate, the mouth of the Chesapeake, Honolulu Harbour. If you sailed it, grew up on it, or got married beside it, the print is about that. If you did not, it still reads as a beautiful object, which is the rare combination.
The practical point: coastlines are wider than they are tall, so most of these sheets are markedly horizontal. That is the shape of the wall above a sofa, a headboard or a console table — the exact proportion a square canvas never fits.
The public-domain part
Charts produced by the US Coast Survey and its successors are US government works and not subject to copyright in the United States. NOAA has digitised thousands of historical sheets at high resolution and publishes them freely. That is where ours come from, and each product page names the sheet and links the archive record.
Modern NOAA electronic charts are a different matter, and so is the Admiralty’s current output — both are in copyright and neither belongs on a wall anyway.
Our twenty-eight coastal sheets are on the coastal wall art page. If your stretch of water is missing, the custom request form usually finds it within a few days: the archive is far larger than what we have restored so far.
Sources
Where this came from
- NOAA Historical Map & Chart Collection
- NOAA — history of the Coast Survey
- Library of Congress — Geography and Map Division
Corrections are welcome and we publish them — info@antiquemapprints.com. Nothing here is generated from a template; if something is wrong it is our mistake, not a machine's.


